
They say in sport form is temporary, but class is permanent. Any world-class sportsman or woman can and do go through a period when they just can’t get the results they expect. Their touch or timing might not quite be there or perhaps luck is just not with them, but, in the end, their quality shines through and the performances and results come back.
Alistair Cook is one of England’s greatest cricketers of all time, he has played the most Tests (161), scored the highest runs (12,472) and the most centuries (33). His batting average for his England Test career is 45.35 from 291 innings, a record that puts him amongst the greats of the game. He also had periods during his career when the runs were hard to come by. The chart* below shows Cook’s Test career.
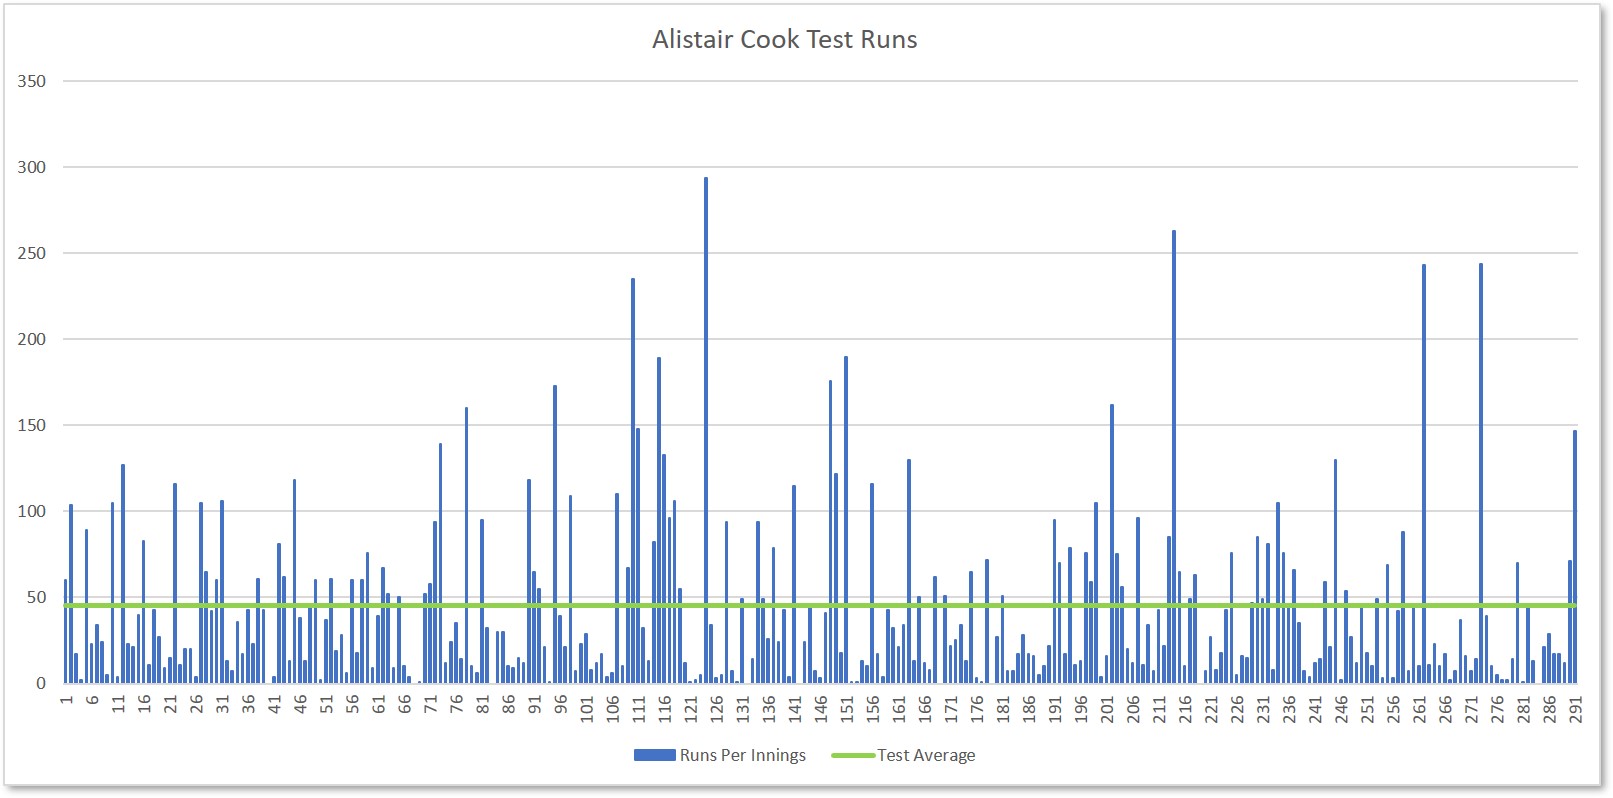
Each blue bar represents his score in each of his 291 Test innings, the green line is his Test average. What stands out is the number and frequency of high scores, including 5 over 200. But there are also periods when he struggled with the bat and people questioned his place in the team, particularly in the latter stages of his career.
Any batsman is judged by the centuries he scores and there were periods when they were hard to come by; 28 innings without one between his 46th and 75th innings, 36 between his 163rd and 199th. There were also periods when he repeatedly scored below his average. But, in beautiful synchronicity and to show his class as a batsman, the form returned in his final ever Test match during which he scored a hundred to match the one in his first-ever Test match.
In sport, so too in investing.
There is an investment term called ‘Reversion to the Mean’, put simply, this is the observation that the returns of an investment may look really strong or weak for a period of time but sooner or later they return (revert) to the average of those returns (mean). Linking it back to Alistair Cook, this would apply to periods where he consistently scored below his Test average, only to find his form again and score well in a match.
Think also of Leicester City winning the Premier League title in 2016; the season before they just avoided relegation and were a 5000/1 to win the title in the 2015/16 season. So, to win the title that year was a phenomenal achievement but well beyond what was naturally expected. It was an outlier in a series of average returns that has seen them move between mid-table, to relegation. They are now regarded as a strong team outside of the established big clubs but the chance of winning the title again is remote.
The same principles apply to investment returns.
The chart** below shows the calendar year returns for the S&P500 in the US over the past 90 years (I use US returns because the data is more readily available, over a longer period of time and can be seen as a proxy for global returns). You can see much like the form of a Test batsman, it goes through high and low points. The average return is 8% pa over the 90 years but the variation is as great as a 68% return in 1956 and a -51% return during the height of the Great Depression in 1932.

The highs and lows of stock market returns demonstrate this reversion to the mean. The Great Depression years were an extremely difficult time for anyone living through them as they were for investors. Four years of double-digit negative returns tested the resolve of all but the most patient and resolute investors but they were rewarded by the quick recovery in 1934 and a subsequent decade which averaged 9% pa.
But, as the lows give way to the highs, so do the highs revert to the mean too. The 1990s were an extremely bullish period with average annual returns of 16%. The S&P only recorded one negative year in the whole decade (a -2% return in 1995) but that bullishness overstretched tech stock valuations which foretold the bursting of the tech bubble and coincided with 9/11 and the second Iraq war. The 10 years to 2009 saw an average return of -2% (ignoring dividend income).
Don’t Expect The Average
A final point to make is just because you can calculate an average, it doesn’t mean you will achieve it in any single year. Alistair Cook’s Test average was 45.35 but he only scored 45 once and 46 four times. The S&P returned 8% only once. Furthermore, the average is also a moving feast as returns wax and wane on a year-by-year basis.
If world-class sportsmen and women have to accept periods of poor form during a career of quality, stock market investors must accept periods of negative returns as part of an upward trend of growth.
I’m sure if, at the start of his career, Alistair Cook was told he would become one of England’s greatest batsmen but he would have to experience periods where the runs didn’t come he would have willingly accepted it. So too must, the equity investor accept periods of temporary losses if they wish to achieve higher long-term returns for the pension and investment funds.
Photo by Steve Clayton on Unsplash
*Source: https://www.espncricinfo.com/england/content/player/11728.html
** Source: Yahoo Finance. Returns are 1st January to 1st January each year.